📋 Question
Create Reports in Power BI
You are given an product data
You Need to find those results given in the image and visualize using power bi
Dataset: Download Sample Dataset
Requirements:
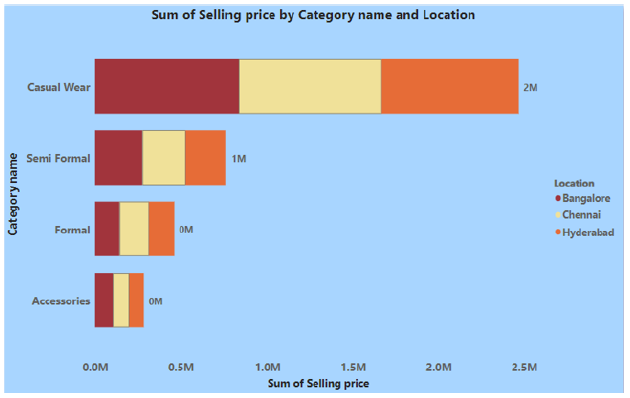
- Create a Stacked Bar Chart as shown below.
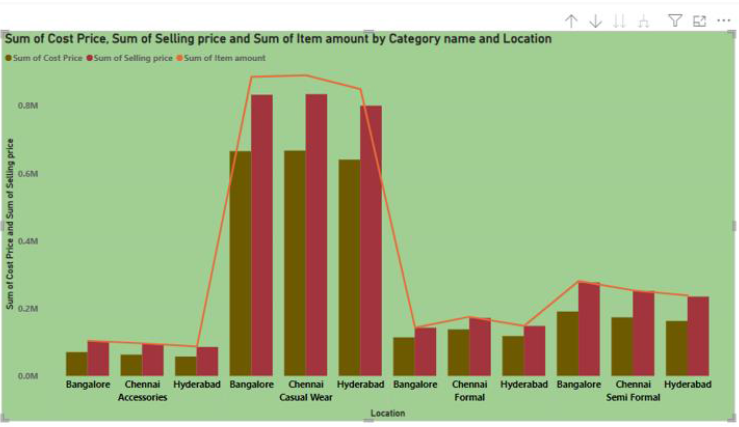
- Create Line and Clustered Column Chart and set the Drill through in the chart.
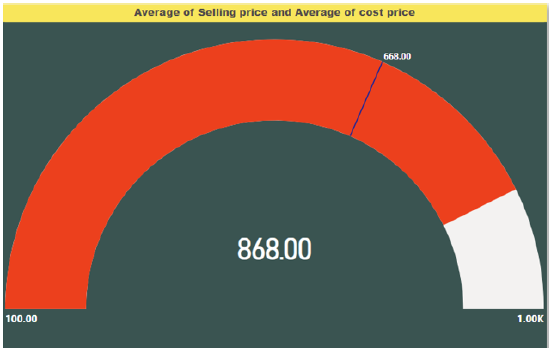
- Create a Gauge chart and set the target value as Average of Cost Price.
- Need to find the result as per the given image
✅ Expected Output
Your final output should look like the example below: